Unprecedentedly extreme precipitation occurred in Pakistan (PAK), and mega heat waves persisted along the Yangtze River Valley (YRV) from July to August 2022. Using the advanced multiscale window transform-based canonical transfer attribution framework, we quantitatively delineated intra-scale and inter-scale interactions leading to record-breaking spatially concurrent extremes in 2022 and comprehensively revealed differences in dynamic processes affecting extreme events in July and August. The basic flow scale window lost the available potential energy (APE), and through APE canonical transfers to the intraseasonal-scale and synoptic-scale windows, the inter-scale dynamic processes and barotropic instability of the basic flow scale preserved the concurrent extreme in July. In August, the eruptive synoptic-scale kinetic energy convergence provided dynamic conditions for the sinking motion of the YRV and its advection to PAK from the Indian Ocean. Consequently, the interaction between high- and low-frequency processes drove atmospheric circulation in summer, but the high-frequency process in August played a vital role in extreme events. Additionally, the heat source in the tropical western-central Pacific is considered one of the key drivers for localized repetitive bursts of energy. This study emphasizes both the interactions between multiple scales of atmospheric dynamics and reveals the driving mechanisms behind the impacts of warming on extreme events, linking the external forcing issue with the free problem of atmospheric internal instability.
The Earth is undergoing a rapid and pronounced rise in temperature, which disrupts the fragile equilibrium of the atmospheric energy budget, thereby prompting the intensification of the water cycle 1,2 . Increased extreme precipitation characterizes this transformation process 3,4 . Additionally, global warming has led to an increase in heat waves, droughts, wildfires, and even intensified hurricanes 5,6 . Notably, spatiotemporal connections among extreme events have also intensified 7,8 . These concurrent or consecutive extreme events seriously impact natural and social environments, with their occurrence mechanisms and patterns exhibiting more complexity, and have recently occurred frequently 9,10 .
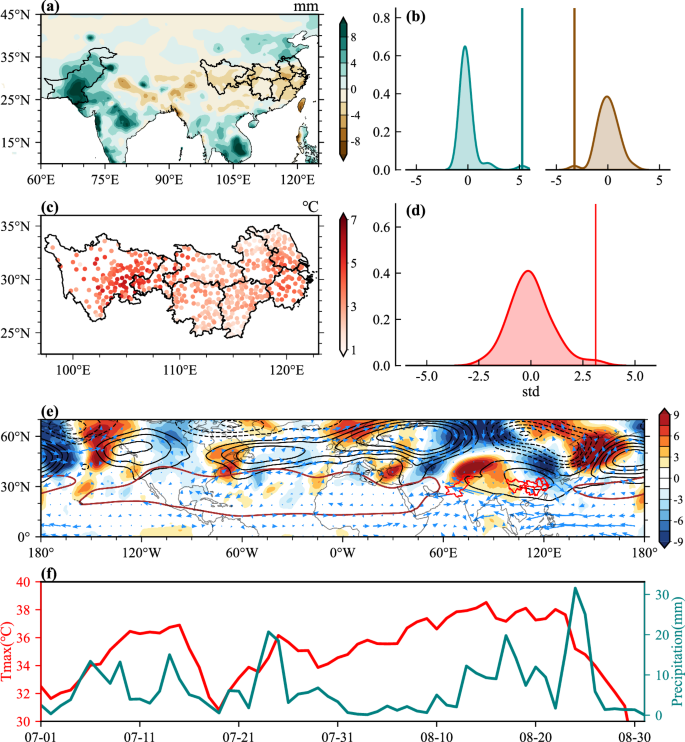
Notably, the boreal summer (July–August) of 2022 witnessed unparalleled concurrent climate extremes in Southwestern and East Asia (Fig. 1a, c). Southwestern Asia, particularly Pakistan (PAK), experienced a sequence of unusually extreme precipitation events, causing widespread landslides and flooding across one-third of the country 11 . Devastating floods have led to the displacement of over 30 million people and economic losses exceeding USD 30 billion 12 . Simultaneously, a mega heat wave caused widespread bursts, crop damage, and wildfires across the Yangtze River Valley (YRV), lasting 79 days and surpassing records since 1961. Moreover, an area encompassing 1,029,000 km 2 experienced daily maximum temperatures of 40 °C or higher 13,14 . Concurrently, the duration of drought generally ranged from 20 to 30 days, with some areas experiencing over 30 consecutive days, leading to power failures and wildfires 15 . The economic and social impacts of such concurrent extremes underscore the urgency of comprehending their physical mechanisms and severity, as well as constituting effective strategies to mitigate their impacts.
This evidence strongly indicates that anomalous zonal flow over the subtropical Tibetan Plateau (TP) is pivotal for understanding the concurrent extreme events observed in mid-summer 2022 16 . Subsequent studies have further indicated that spring thermal conditions over the TP amplified meridional winds in the western Indian Ocean, consequently causing the northward migration of the East Asian westerly jet (EAWJ) 17,18 . Consequently, this contributes to the northeastward expedition of the South Asian High (SAH) and the northwest expedition of the Western Pacific Subtropical High (WPSH) 19 . Atmospheric teleconnections, reminiscent of Rossby waves, also play a vital role in orchestrating the simultaneous incidence of disparate climatic events in geographically distant regions 20,21 . A distinct and persistent Rossby wave-like pattern emerged as a crucial factor linking flooding in the PAK and heatwaves in the YRV in the summer of 2022 15,17 . In addition, Tang et al. 22 emphasized the concurrent presence of the triple-dip La Niña phenomenon in 2022 coupled with the second-highest recorded SST gradient in the equatorial western Pacific, which also assumes a significant role in enhancing these concurrent extreme events 23 . The triple-dip La Niña altered the location of strong atmospheric convection accompanied by formidable diabatic heating linked to unprecedented rainfall in PAK, amplifying this climatic interplay by reinforcing the downstream Rossby wave train 13 . This reinforcement extended the upper-level SAH eastward, exerting substantial control over the entire YRV 22,24 .
Comprehending the spatial distribution, progression, and mechanisms underlying the 2022 spatial concurrent extreme event is essential for formulating effective strategies to mitigate their impacts in the future. Such an occurrence is not an isolated phenomenon experienced solely in the 21st century 25 . PAK previously experienced severe extreme precipitation and floods in 2020 and 2010 26 , which caused extreme events in the YRV via an extratropical Rossby wave-like perturbation 20,27 . Branstator (2002) stressed that extreme weather event variabilities in the mid-latitudes are primarily controlled by large-scale wave dynamic impacts and their interaction with synoptic-scale systems, leading to co-variability in distant regions 28 . Amplified Rossby waves are likely to lead to more frequent extremes across hemispheres 29 . Simultaneous extreme events in 2022 may not have occurred by chance but because they were linked via large-scale wave patterns and enhanced by multi-scale interactions. However, the potential co-occurrence mechanisms of the extremes have not yet been systematically quantified.
Thus, in this study, the advanced multiscale window transform (MWT), which is scale-window-based and localized in both space and time, was employed to assess the probability of extreme precipitation in PAK and mega heatwaves in the YRV occurring simultaneously 30,31,32 . We analyzed the role of atmospheric circulation in setting favorable locations for extreme events in PAK and the YRV during the summer of 2022 using MWT-based multiscale energetics analysis 31,32 . In addition, we quantified the potential contributions of these mechanisms to the occurrence of concurrent events and revealed the physical processes by which they interact with each other.
During July–August 2022, PAK witnessed extraordinary precipitation, far exceeding the usual levels for the normal period, with the southern regions experiencing an excess of 10 mm per day (Fig. 1c). Unprecedented by its extremities, this event unfolded with a concurrent manifestation of compound droughts and heat waves in the YRV (Fig. 1a, b, d). The western YRV (Chongqing and Sichuan province) served as the epicenter of this compound drought and heat waves, with certain areas experiencing temperature anomalies exceeding the 1961–2020 mean 5 °C, while the entire YRV underwent an unparalleled shortage of rainfall. Figure 1f shows the daily variation in domain-averaged precipitation in PAK and temperature in the YRV, exhibiting coverability and synchronous phases. Furthermore, we examined the atmospheric conditions (Fig. 1e). Strengthened and extended westward high pressure (WPSH) was located at the YRV and north PAK, transporting abundant moisture to the south of PAK and promoting precipitation.
The energies were integrated over the domain (20°–35°N, 60°–120° E) and vertically from 850 to 200 hPa for July and August, respectively. Based on this, we identified and tracked the dynamic mechanisms within and between scales at different stages. In July, the basic flow window mainly lost APE through canonical transfers to both the intraseasonal- and synoptic-scale windows (Fig. 2a). Although there were profits and losses at other scales, evidently, inter-scale dynamic processes dominated in July. A large amount of APE was converted into KE (accounting for about 20% of total APE, 100.1 × 10 10 W), primarily driven by the basic flow scale window (−91.03 × 10 10 W). It implies that the buoyancy conversion of the basic flow contributes significantly, although a substantial portion (83.92 × 10 10 W) of the KE provided by this conversion in the basic flow scale window is divergent through the work done by the pressure gradient. The intensified zonal easterlies of all scale windows contributed to the occurrence of barotropic instability (Tabel S1). This further amplified the amplitude of the Rossby wave, further enhancing the low-frequency easterlies in the southern region (Fig. 2c). This facilitated the maintenance of multiscale anomalous easterlies in July. Therefore, the barotropic instability of the basic flow scale window played a pivotal role in triggering the entire July event.
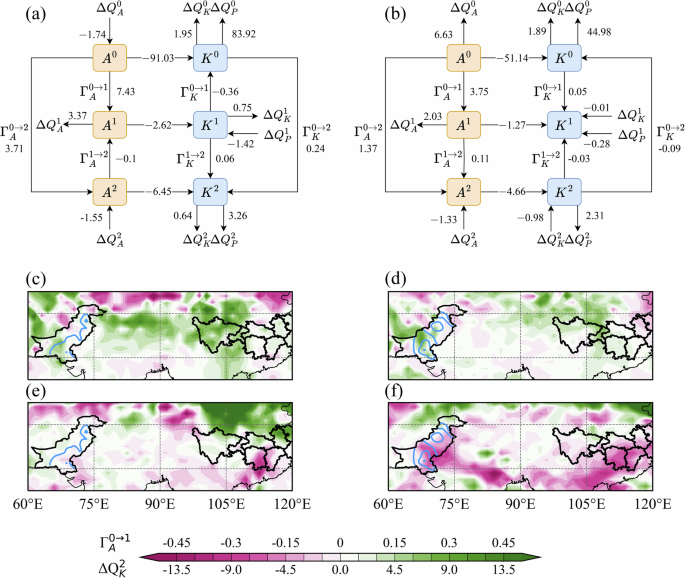
Similar to July, the APE canonical transfer persisted in August, albeit with a slightly diminished intensity (Fig. 2b, d). To maintain the high temperatures in the region, the overall buoyancy conversion of APE is reduced (accounting for about 10% of total APE). A positive APE influx was observed in the intraseasonal-scale window (0.45 × 10 10 W, Fig. 2b). This dual increase mirrored the warming trend in the YRV during August as well as served as a driving force behind the intermittent extreme precipitation episodes witnessed in PAK. Furthermore, the positive APE canonical transfer from the intraseasonal to the synoptic-scale window underscored the dynamics of low-frequency barotropic instability, ultimately benefiting the occurrence of extreme precipitation in PAK. Notably, it exhibited a notable influx of KE within the synoptic-scale window (Fig. 2f). The intensified convergence of the KE was particularly pronounced in the southern region of PAK, highlighting the extreme precipitation concentration in the southern part of PAK throughout August (Fig. 1c). Therefore, limited inter-scale and intra-scale processes led to the occurrence of concurrent extreme events in August.
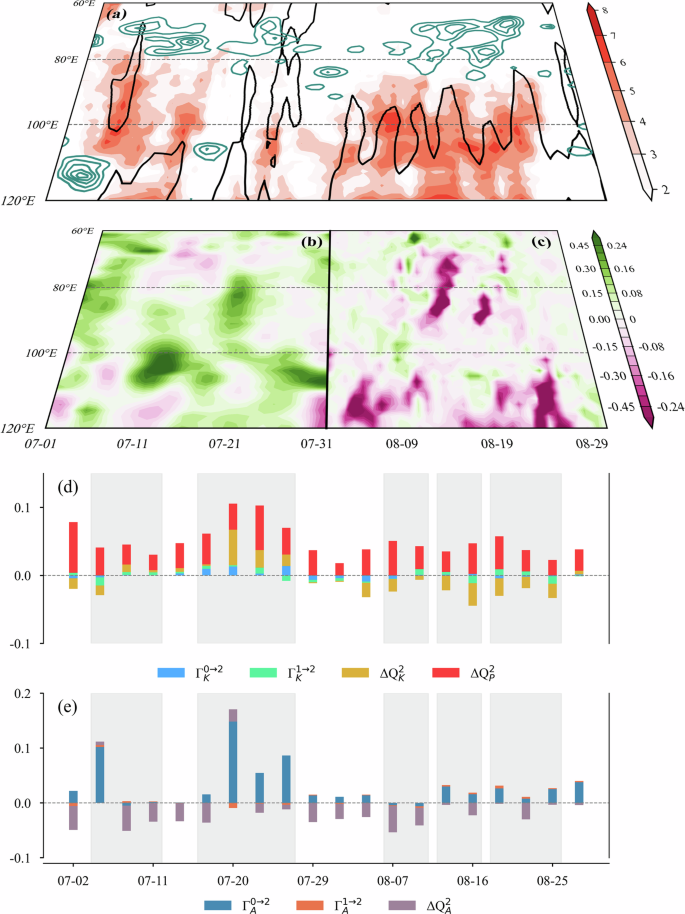
We further investigated the causes of each lifecycle of events and quantified the absolute contributions of multiscale energetic terms during the cycle (Fig. 3). We employed the emergence and evolution of pivotal energies as markers to delineate event temporal phases. In July, two intermittent concurrent extreme events occurred, with a discontinuous westward extension of the western Pacific subtropical high (Fig. 3a). During the period from July 3 to July 28, the YRV and PAK were dominated by baroclinic instability from the basic flow scale window (Fig. 3b), associated with the gradual westward shift of the subtropical high and continuous precipitation over PAK (Fig. 3a). The APE and KE fluxes within the scale exhibited divergence and failed to facilitate the occurrence of the event (Fig. 3d, e and S1). Meanwhile, the onset of two phases in two July events was accompanied by an explosive canonical transfer of APE from the basic flow scale to the intraseasonal- and synoptic-scale windows, indicating a pronounced baroclinic instability process triggered heavy rainfall in Pakistan during July (Figs. 3e and S1b). Given the ample source of APE in July (Figs. 2a, 3e and S1b), this suggests that the significant thermal effect of the preceding snow accumulation on the Tibetan Plateau was a crucial factor in the extreme development of these events 11 . In August, the western Pacific subtropical high exhibited a high-frequency continuous westward expansion. During this time, the YRV experienced continuous and persistent heat conditions, whereas the extreme precipitation in PAK showed three westward-moving processes (Fig. 3a). In addition to the APE canonical transfer from the basic flow scale window, similar to July, notably, the convergence of the KE flux began within this scale (Figs. 3c, d, and S1a). This contrasts with the characteristics of the scale observed in July. The convergent KE flux provided favorable conditions for the maintenance of the synoptic systems for both PAK and the YRV. The convergence exhibited the characteristics of a triple westward shift, which perfectly matched the three westward extreme precipitation events in PAK temporally and spatially (Fig. 3c). Fu et al. 12 further demonstrate that this dynamic connection is most active from July to August. When significant convective variability occurs over PAK, divergent flow excites barotropic Rossby waves, which then propagate eastward along the upper troposphere westerly waveguide and influence extreme events in East Asia 12 . In addition, the inter-scale interaction culminated in concurrent extreme events in July and August, with the August event being bolstered by amplification through contributions from synoptic intrascale energy. Therefore, events in August were generally more extreme than those in July and exhibited high-frequency characteristics.
In this study, our objective was to elucidate the underlying factors contributing to the unprecedented precipitation in PAK and concurrent mega-heatwaves in the YRV during the boreal summer (July–August) of 2022. In PAK, five consecutive severe precipitation events caused catastrophic floods, which were distinguished by the presence of monsoon surges and anomalies in Tibetan Plateau Thermodynamics 11 . Atmospheric blocking over northern Europe and easterly anomalies enhance convection by transporting high-latitude cold‒dry air and warm‒wet monsoonal air converging in PAK. With stronger convection in PAK, two upper-tropospheric anomalous anticyclones over Iran and eastern Asia. The western anomalous anticyclone exhibits a baroclinic structure with low-level southwesterlies and convergences over PAK. The eastern one has a quasi-barotropic stationary Rossby wave structure. The upper-tropospheric divergence stimulated by convective heating over PAK leads to negative Rossby waves and promotes the downstream response over East Asia 12 . Accordingly, the mid-latitude wave train is connected with dry and colder air and a pronounced easterly anomaly linked with triple-dip La Niña (Fig. 1e), coupled with a heightened southerly flow originating from the Arabian Sea 11,26 . Notably, the influential factors exhibited parallels with the 2010 flooding in PAK but had more destructive effects.
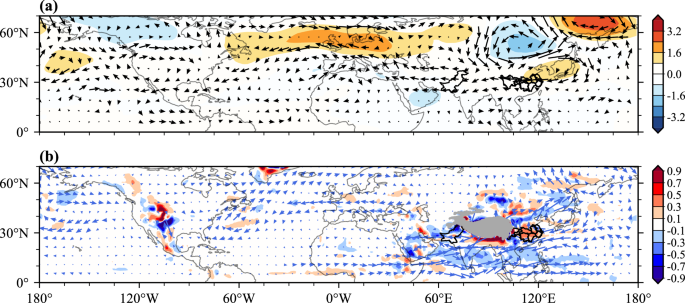
In Fig. 4, the numerical experiments showed that the mid-latitude wave train originates from the eastern North Atlantic, traverses Eurasia, and extends toward the Indian subcontinent and Eastern Asia, which links extreme precipitation in PAK and mega-heatwaves in the YRV and evidently revealing their concurrent probability. Previous studies have suggested the circulation anomalies mentioned above can influence local synoptic systems and enhance concurrent events 33,34 . Therefore, utilizing the multiscale window transform-based canonical transfer, two concurrent extreme events from July 3 to July 28 occurred in PAK and the YRV in July and were primarily dominated by baroclinic instability from the basic flow scale window, linked with the gradual westward shift of the WPSH. The initial phase of the two events was a massive influx of APE for synoptic- and intraseasonal-scale windows via canonical APE transfer from the basic flow scale window. With continuous precipitation in PAK, APE and KE fluxes within the scale still exhibited divergence and failed to facilitate the occurrence of the event. In August, the WPSH exhibited a high-frequency continuous westward expansion. Meanwhile, extreme precipitation in PAK showed three westward-moving processes, which were linked with the APE canonical transfer from the basic flow scale window and influenced by the convergence of the KE flux that began within the scale. In addition, the KE convergence exhibited the characteristics of a triple westward shift, which perfectly matched the three westward extreme precipitation events in PAK temporally and spatially. Opposite energy characteristics were observed in July and August. The convergent KE flux provided favorable conditions for the maintenance of the synoptic systems for both PAK and the YRV. The inter-scale interaction culminated in concurrent extreme events in July and August, with the August event bolstered by amplification through contributions from synoptic intrascale energy. Therefore, the event in August was more extreme than that in July.
The meteorologically observed daily maximum temperature (Tmax) for 1961–2022 was provided by the National Meteorological Information Center of the China Meteorological Administration. After quality control procedures and homogeneity assessments, 508 meteorological stations were chosen in the YRV 15 . The Climate Prediction Center (CPC) of the National Oceanic and Atmospheric Administration (NOAA) provided daily precipitation data, with a horizontal resolution of 0.5° × 0.5° 35 . Six hour temporal resolution and monthly horizontal wind, omega, geopotential height, and air temperature at 12 vertical levels ranging from 1000 to 100 hPa with a horizontal resolution of 0.25° × 0.25° were acquired from the fifth major global reanalysis (ERA5) produced by the European Centre for Medium-Range Weather Forecasts spanning from 15 October 1978 to 12 December 2022, covering 2 16 days 36 .
Liang and Anderson (2007) introduced the multiscale window transform (MWT) to address the limitations of traditional filters. The MWT offers reconstructions (filtered windows) and yields transform coefficients, which are crucial for defining the energy associated with a filtered field, such as the Fourier space 37,38,39 . This method decomposes the function space orthogonally into windows of different scales. In this study, basic- (>64 days), intraseasonal- (8–64 days), and synoptic-scale windows (>=0,\,1,>\,2,\) respectively. More comprehensive introductions to the MWT can also be found in ref. 32 .
Based on the MWT, multiscale energy canonical transfer in different windows is subsequently represented, which effectively combines with Lorenz’s formalism. This transfer bears a Lie bracket form similar to the Poisson bracket in Hamiltonian dynamics, satisfies the Jacobian identity, and possesses various other properties, making it a robust and well-defined tool for the analysis of multiscale atmospheric energetics 30,31 . It is effective for characterizing multiscale interactions and local variations in atmospheric energy during extreme events. Accordingly, the multiscale kinetic energy (KE) equation and available potential energy (APE) for different scale windows are as follows 32 :